Nguyễn Đặng Xuân Linh - Data Analyst Portfolio

Pizza Sales Report
Analyze key indicators for pizza sales data to gain insight into business performance. Using Power BI to visualize our insights and SQL to validate key metrics .
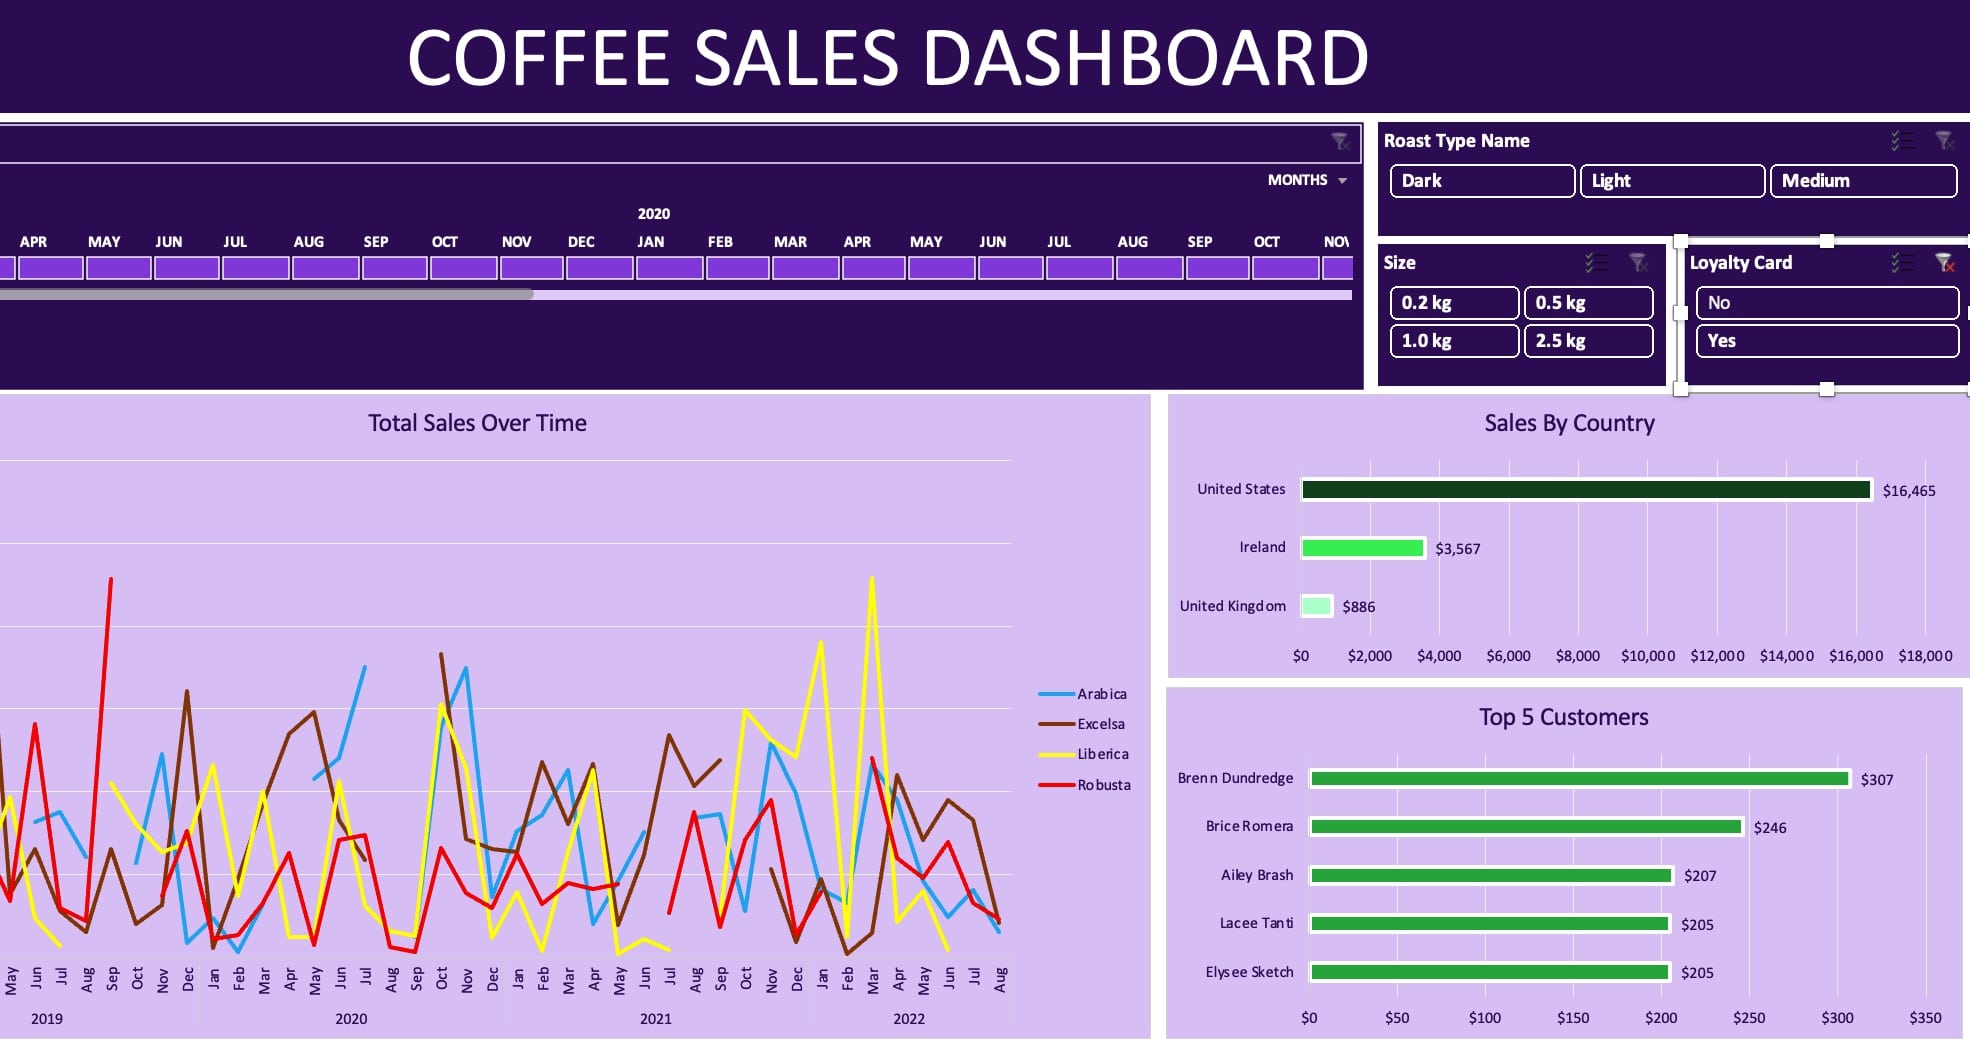
Coffee Sales Dashboard
Using Excel to build a dynamic interactive coffee sales dashboard with PivotTables and time-series data.

eBay Cars Sales
Personal project using Python Pandas and Numpy to build a clean dataset and analyze the price difference.

App Profiles for App Store and Google Play Markets
A project to explore which mobile app profiles are profitable for the App Store and Google Play markets.

SQL for Products and Customers
Work with sales records database for scale model cars and analyze data for decision-making.

Heavy traffic indicators on I-94
Analyzed a few indicators of heavy traffic on I-94 using exploratory data visualization techniques to explore patterns.

Hackers News Posts
A project for determining which type of post and time receive the most comments on average.